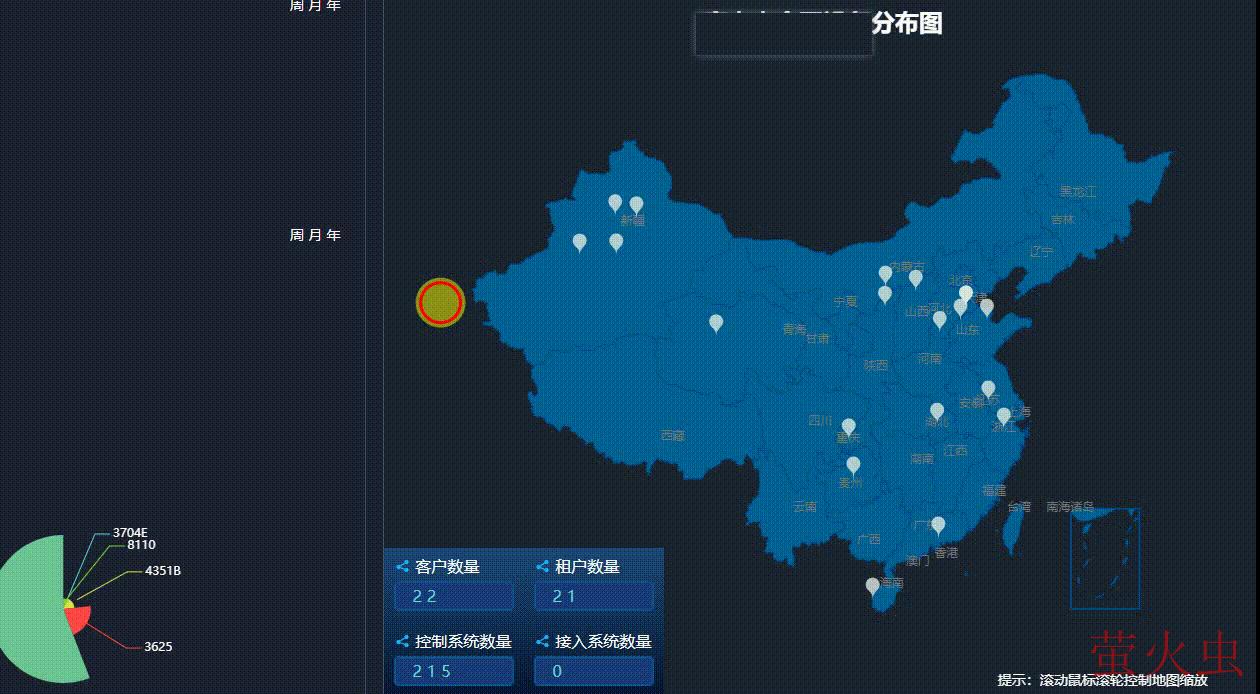
导入方法:1、使用“npm install echarts -S”命令安装echarts依赖;2、在“main.js”中全局引入echarts;3、在需要地图的页面中使用import语句引入“china.js”文件,添加相关代码即可。

本教程操作环境:windows7系统、vue2.9.6版、DELL G3电脑。

需求:显示各省名字,滑过标记地显示接入数量,点击标记地 显示系统数量已接入及能跳转对应页面信息的入口;
配置:
1.安装依赖
npm install echarts -S
2.全局引入main.js
// 引入echarts
import echarts from 'echarts'

Vue.prototype.$echarts = echarts
3.在需要地图的页面引入 地图 china.js 查看官方文档 ,我自己保存的 china.js 点击下载(提取码 4rxi )
import '../../../static/js/chinamap/china.js' // 引入中国地图数据
使用:
完整实例代码:
<template>
  <div class="Page">
    <div id="myChartChina" :style="{width: '100%', height: '710px'}"></div>
    <div class="projectList">
      <div>
        <p> <i class="el-icon-share"></i> 客户数量</p>
        <div class="inputList">3600</div>
      </div>
      <div>
        <p> <i class="el-icon-share"></i> 租户数量</p>
        <div class="inputList">1500</div>
      </div>
      <div>
        <p> <i class="el-icon-share"></i> 控制系统数量</p>
        <div class="inputList">20800</div>
      </div>
      <div>
        <p> <i class="el-icon-share"></i> 接入系统数量</p>
        <div class="inputList">3600</div>
      </div>
    </div>


    <div id="box" v-if="ifbox">
      <div class="box_left">
        <div class="box_title">{{TipsList.name}}</div>
        <div class="box_list">
          <p>{{TipsList.value[2]}}</p>
          <p>系统数量</p>
        </div>
        <div class="box_list box_lists">
          <p>{{TipsList.num[2]}}</p>
          <p>已接入</p>
        </div>
        <div></div>
      </div>
      <div class="box_right" @click="toClient(TipsList.id[2])">
        <i class="el-icon-arrow-right"></i>
      </div>
    </div>

    <div class="box_Tips">
      <p>提示:滚动鼠标滚轮控制地图缩放</p>
    </div>

  </div>

</template>

<script>
import '../../../static/js/chinamap/china.js' // 引入中国地图数据
export default {
  data() {
    return {
      ifbox:false,
      TipsList:[],
    }
  },
  mounted() {
    this.ChinaMap();
  },
  methods: {
    //点击模拟数据右箭头跳转外页面,
    toClient(id){
      this.$router.push({
        path: "/Client",
        query: { lesseeCompanyId: id }
      });
    },
    ChinaMap(){
      var that=this;

      //模拟数据
      let data = [
          {name: '海门', value: 90 ,num: 5,id:8},
          {name: '鄂尔多斯', value: 102 , num: 15, id:16},
          {name: '齐齐哈尔', value: 140, num: 30 ,id:20}
      ];
      let geoCoordMap = {
          '海门':[121.15,31.89],
          '鄂尔多斯':[109.781327,39.608266],
          '齐齐哈尔':[123.97,47.33]
      };

      var convertData = function(data) {
          var res = [];
          for (var i = 0; i < data.length; i++) {
              var geoCoord = geoCoordMap[data[i].name];
              if (geoCoord) {
                  res.push({
                    name: data[i].name,
                    value: geoCoord.concat(data[i].value),
                    num: geoCoord.concat(data[i].num),
                    id: geoCoord.concat(data[i].id)
                  });
              }
          }
          return res;
      };


      let myChartChina = this.$echarts.init(document.getElementById('myChartChina')) //这里是为了获得容器所在位置
        window.onresize = myChartChina.resize;
        myChartChina.setOption({ // 进行相关配置
          backgroundColor: '#1c2431',//地图背景色
          geo: { // 这个是重点配置区
            map: 'china', // 表示中国地图
            label: {
              normal:{
                show: true, // 是否显示对应地名
                textStyle: { //字体颜色
                  color: '#797979'
                }
              },
              emphasis: {
                show: false,
                textStyle: {
                  color: '#fff'
                }
              }
            },
            roam: true,
            itemStyle: {
              normal: {
                borderWidth: 1, // 地图边框宽度
                borderColor: '#014888', // 地图边框颜色
                areaColor: '#026295' // 地图颜色
              },
              emphasis: {//选中省份的颜色
                areaColor: '#026295',
                shadowOffsetX: 0,
                shadowOffsetY: 0,
                shadowBlur: 0,
                borderWidth: 1,
                shadowColor: '#fff'
              }
            }
          },
          //滑动显示数据
          tooltip: {
              trigger: 'item',
              formatter: function(params) {
                  return params.name + ' 已接入: ' + params.data.num[2];
              }
          },
          series: [{
              name: '散点',
              type: 'scatter',
              coordinateSystem: 'geo',
              color:"#e1ebe3",//点的颜色
              data: convertData(data),
              symbolSize: 25,//点的大小
              symbol:"pin",//点的样式
              cursor:"pointer",//鼠标放上去的效果
              label: {
                normal: {//默认展示
                    show: false
                },
                emphasis: {//滑过展示
                    show: false
                }
              },
              itemStyle: {
                emphasis: {
                  borderColor: '#5c8f6e',
                  borderWidth: 5
                }
              }
            },

            {
              type: 'map',
              map: 'china',
              geoIndex: 0,
              aspectScale: 0.75,
              tooltip: {
                  show: false
              }
            },

          ],
        })
        // if (myChartChina && typeof myChartChina === "object") {
        //     myChartChina.setOption(myChartChina, true);
        // }
        myChartChina.on('click', function (params) { //点击事件
          if (params.componentType === 'series') {
            if(params.data){
              that.TipsList=params.data
              that.ifbox=true
              that.boxPosition()

            }else{
              that.ifbox=false
            }
          }
        });
    },
    //点击地点显示对应位置数据
    boxPosition(){
      var e = event || window.event;
      var x=e.clientX+145+"px",
          y=e.clientY+5+"px";
      clearTimeout(t)
      var t = setTimeout(function (){
        $('#box').css('top',y),
        $('#box').css('left',x)
      }, 100);
      t
    },

  }

}
</script>
<style scoped>
.Page{
  position: relative;
}
.projectList{
  position: absolute;
  bottom:0;
  left:0;
  z-index: 100;
  width: 280px;
  height: 150px;
  background: linear-gradient(#1d4978, #081630);
  display: flex;
  flex-wrap:wrap;
  justify-content:space-around;
  align-items:center;
}
.projectList>div{
  width: 120px;
  height: 55px;
}
.projectList>div>p{
  color: #fff;
  font-size: 16px;
}
.projectList>div>p>i{
  color: #12baf9;
}
.inputList{
  width: 120px;
  height: 30px;
  background: #1a3c7b;
  border: 2px solid #0f5390;
  margin-top:7px;
  border-radius: 5px;
  letter-spacing:5px;
  color: #65ddd3;
  line-height: 26px;
  text-indent: 1em;
}


#box{
  width:280px;
  height: 80px;
  background: #026295;
  box-shadow: 0 0 10px #008b9a;
  border: 1px solid #008b9a;
  position: absolute;
  top:10px;
  left: 50%;
  margin-left: -140px;
  color: #fff;
  text-align: center;
}
.box_left{
  width: 239px;
  height: 80px;
  float: left;
}
.box_title{
  width: 238px;
  height: 30px;
  border-bottom: 1px solid #008b9a;
  line-height: 30px;
}
.box_list{
  width: 119px;
  height: 50px;
  float: left;
}
.box_lists{
  border-left: 1px solid #008b9a;
}
.box_list>p:nth-child(1){
  font-size: 20px;
  line-height: 28px;
  color: yellow;
}
.box_lists>p:nth-child(1){
  color: rgb(111, 185, 234);
}

.box_right{
  width: 39px;
  height: 80px;
  border-left: 1px solid #008b9a;
  float: left;
}
.box_right i{
  line-height: 80px;
}


.dilog {
  /* width: 180px; */
  height: 80px;
  background: black;
  position: absolute;
  border-radius: 5px;
  border: solid 1px rgb(0, 139, 154);
  z-index: 11111;
  display: flex;
  box-shadow: 0 0 10px rgb(0, 139, 154);
}
.dilog_title {
  text-align: center;
  height: 30px;
  border-bottom: solid 1px grey;
  line-height: 30px;
  color: white;
}
.box_Tips{
  width:96%;
  height: 20px;
  position: absolute;
  bottom: 5px;
  right: 5px;
  font-size: 14px;
  color: #fff;
}
.box_Tips>p{
  white-space: nowrap;
  position: absolute;
  top: 0px;
  left: 0;
  animation:mymove 30s infinite;
}
@keyframes mymove
{
from {left: 70%;}
to {left: 0%;}
}
</style>完成后的图片:样式更改可查看官方文档自行修改;更多地图实例 请点击查看https://gallery.echartsjs.com/explore.html#charts=map~sort=rank~timeframe=all~author=all
相关推荐:《vue.js教程》
以上就是vue怎么导入echarts地图的详细内容,转载自php中文网


发表评论 取消回复